 |
|||||||||
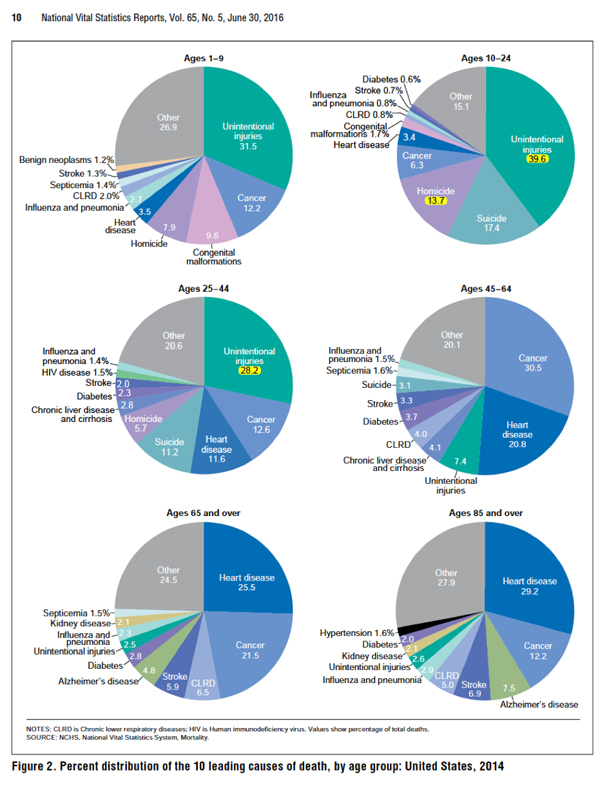
Avoiding Unintentional Injuries Among people of all ages there were about 161,374 deaths in 2016 from unintentional injuries in the U.S.[1] They were, for the first time, the third leading cause of death, exceeded in number only by diseases of heart, and cancer.[2] Figure 2 shows the pattern of unintended injury and other causes of death according to age group. In 2014, unintended injury was the leading cause of death up to age 45.[3]
There were 40,327 motor vehicle fatalities in 2016 and unintentional opioid overdose deaths from drugs including prescription opioid pain relievers, heroin, and illicitly-made fentanyl totaled 37,814. The Centers for Disease Prevention and Control counted an additional 4,435 opioid related deaths because the CDC also includes intentional deaths like homicide and suicides as well as deaths with undetermined intent. Other leading causes of unintentional injury deaths in 2014 were from falls, numbering nearly 32,000, and 33,736 deaths caused by firearms.[4]Unintentional injuries—such as those caused by burns, drowning, falls, poisoning and road traffic—are the leading cause of illness (morbidity) and mortality among children in the United States.[5] Each year, among those 0 to 19 years of age, more than 12,000 people die from unintentional injuries and more than 9.2 million are treated in emergency departments for nonfatal injuries. The CDC Childhood Injury Report provides an overview of unintentional injuries related to drowning, falls, fires or burns, poisoning, suffocation, and transportation–related injuries among others, during the period 2000 to 2006.[6] Key findings from the report include the following: Injury Deaths
Lack of sleep impairs attention, judgment, and thinking so it makes a person more likely to have an unintentional injury. With a sleep deficit, we become prone to accidents and dangerous to ourselves and others. Unintentional injuries can happen anywhere and during almost any activity, at home, during sports and other recreation such as in or on the water, as a pedestrian or in a motor vehicle. Back to topSafety in the Home Among older adults, falls are the leading cause of injuries, both fatal and nonfatal. Some preventive measures to avoid falls include staying active to maintain strength and balance, getting physical checkups that include vision screening and eye care, attention to any medications with side effects like feeling dizzy or sleepy, and safety precautions at home. Most falls happen at home and their risk can be diminished by keeping a home well lit; the floors clutter-free by dispensing with small throw rugs or using double-sided tape to secure them to the floor; adding grab bars in the bathroom both beside and inside the tub and next to the toilet. Handrails and lights on all staircases are especially important. Ways to Stay Safe from Fires [7] [8]
Water Safety [9] Drowning is the fifth leading cause of unintentional injury death for people of all ages, and the second leading cause of injury death for children ages 1 to 14 years. Water safety precautions include the following:
Sports Safety [10]
Avoiding Poisonings [11]
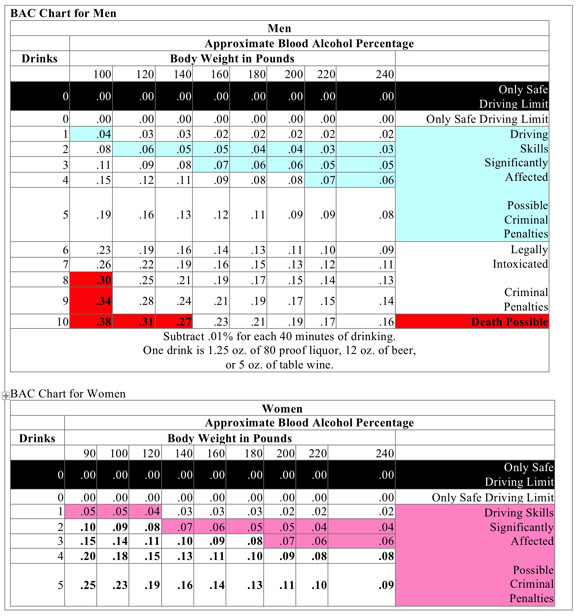
Motor Vehicle Safety [12] Over the past two years (2014-2016), traffic deaths increased by nearly 14% to 40,327 in 2016. The increase is attributed to more driving thanks to low gas prices and an improving economy, and more use of smart phones and other causes of distracted driving. Even hands-free use of phones is a distraction. [13] The National Highway Traffic Safety Administration reported that fatal crashes where drugs were involved increased from 2,003 in 1993 to 7,438 in 2015. Some of these deaths seem to have been related losing consciousness after opioid overdoses. Avoiding buzzed (drug impaired) driving is important. Experimental studies show a clear and dose dependent relationship between marijuana use and a number of indicators of driving impairment. There is evidence from a meta-analysis of nine studies that drivers who use cannabis (marijuana) up to three hours before driving are about twice as likely to cause a collision with serious injury or death as those who have not used cannabis. [14] Although increased legalization of marijuana might make this a more frequent problem, in one study of states that enacted medical marijuana laws and legalized dispensaries, this has not been found. [15] The trend line in driving deaths was not statistically different in Washington and Colorado in the three years after legalization compared to 8 states that did not change their marijuana laws. [16] Alcohol-impaired driving is a common cause of collisions, injuries and deaths. Every day, 28 people in the United States die in motor vehicle crashes that involve an alcohol-impaired driver. The annual cost of alcohol-related crashes totals more than $44 billion. Alcohol involvement for the driver or the pedestrian was reported for 49% of the traffic crashes that resulted in pedestrian death. In most jurisdictions, a quantitative measurement such as a blood alcohol content (BAC) in excess of a specific threshold level, such as 0.05% or 0.08%, defines the offense with no other requirement to prove impairment or intoxication. In some jurisdictions, there is an aggravated category of the offense at a higher BAC level, such as 0.12%. In California it's illegal to operate a motor vehicle with any of the following blood alcohol concentration (BAC) percentages:
The following table shows approximate blood alcohol percentages according to number of drinks and weight for men and women:
Driving defensively, staying within legal speed limits, and avoiding distracted driving are critical to driving safely. Defensive driving means that to reduce the risk of a collision, a driver will both stick to the rules of the road and go beyond them by anticipating and being ready to compensate for errors made by other drivers or other dangerous situations caused by weather or other adverse road conditions. Per mile driven, teen drivers ages 16 to 19 are nearly three times more likely than drivers aged 20 and older to be in a fatal crash. Speeding is one of the most prevalent factors contributing to traffic crashes. The National Highway Traffic Safety Administration (NHTSA) estimated that the annual economic cost to society of speeding-related crashes in 2012 was $40.4 billion and that year speeding was a contributing factor in 30 percent of all fatal crashes, with more than 10,000 lives lost. Among males, 37 percent of 15- to 20-year-old and 37 percent of 21- to 24-year-old drivers involved in fatal crashes were speeding. Among speeding drivers involved in fatal crashes, 42% had blood alcohol concentrations (BACs) of .08 grams per deciliter (g/dL) or higher, compared to only 16% of non-speeding drivers involved in fatal crashes. [17] The chances of being distracted when driving is increasing with the popularity of smart phone use, eating, texting, using a navigation system and other interactive dashboard controls and displays. According to the NHTSA, 71% of young people say that they have sent a text while driving. In 2013, nearly one in five crashes (18%) in which someone was injured involved distracted driving. In 2014, 431,000 people were injured in motor vehicle crashes involving distracted drivers, an almost 10% increase since 2011, and more than 3000 deaths were attributed to distracted driving. [18] There are three main types of distraction:
While any of these distractions can endanger the driver and others, texting while driving is especially dangerous because it combines all three types of distraction.
Some final thoughts on ways to reduce injuries:
[1]Accidental Injury Becomes #3 Cause of Death For The First Time in U.S. History. National Safety Council. Jan 17, 2018. https://www.prnewswire.com/news-releases/accidental-injury-becomes-3-cause-of-death-for-the-first-time-in-us-history-300583720.html
[3]
Heron M. Deaths, Leading Causes for 2014.National vital statistics reports; vol 65 no 5.
Hyattsville, MD: National Center for Health. 2016. Statistics. 2016. [4]Kochanek KD, Murphy SL, Xu J, Tejada-Vera B. Deaths: Final Data for 2014. National Vital Statistics Reports, Vol. 65 No. 4, June 30, 2016.
[5] Borse NN, Gilchrist J, Dellinger AM, Rudd RA, Ballesteros MF, Sleet DA. CDC Childhood Injury Report: Patterns of Unintentional Injuries among 0 -19 Year Olds in the United States, 2000-2006. Atlanta (GA): Centers for Disease Control and Prevention, National Center for Injury Prevention and Control; 2008.
[7]Torpy, JM, Lynm, C, Glass, RM, Burn Injuries JAMA Patient Page, p. 1828 JAMA, October 28, 2009—Vol 302, No. 16, www.jama.com.
[13]Boudette NE. Traffic Deaths in Estimate, Pass 40,000 for First Time Since ’07. New York Times, February 16, 2017.
[14]Asbridge M, Hayden JA, Cartwright JL. Acute cannabis consumption and motor vehicle collision risk: systematic review of observational studies and meta-analysis BMJ 2012; 344 :e536.
[15]Santaella-Tenorio J, Mauro CM, Wall MM, et al. US Traffic Fatalities, 1985–2014, and Their Relationship to Medical Marijuana Laws, American Journal of Public Health. 2017;107(2):336-342. DOI: 10.2105/AJPH.2016.303577.
[16]Aydelotte JD, Brown LH, Luftman KM, et al. Crash Fatality Rates After Recreational Marijuana Legaliation in Washington and Colorado. American Journal of Public Health. 2017; 107(8):1329-1331. DOI: 10.2105/AJPH.2017.30848.
[17]Traffic Safety Facts, 2012 Data: Speeding. National Highway Traffic Safety Administration.
https://crashstats.nhtsa.dot.gov/Api/Public/Publication/812021 |
|
|||